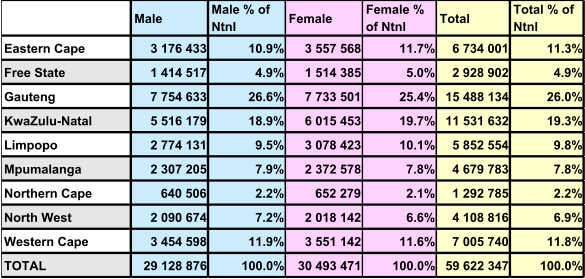
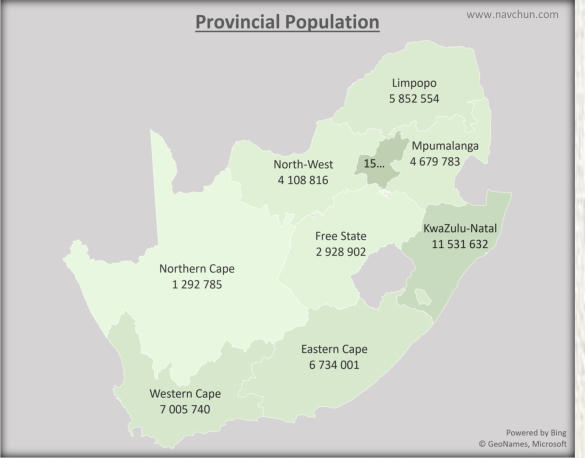
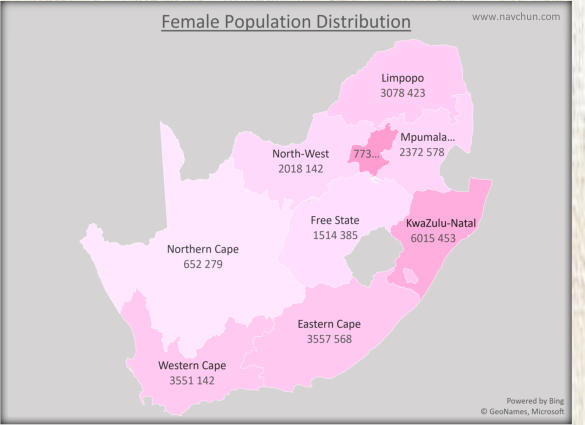
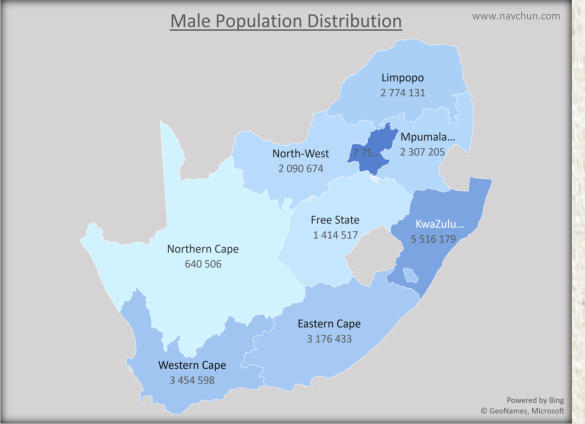
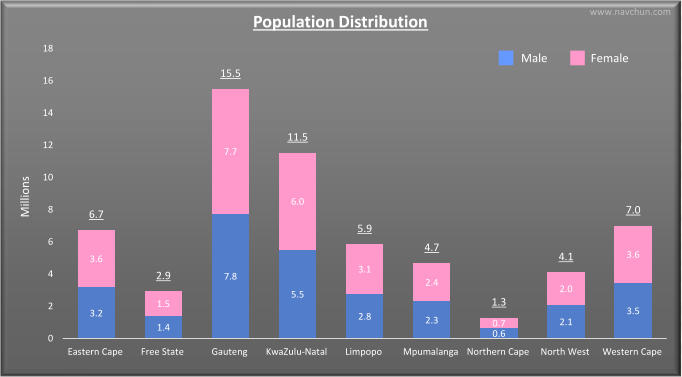
TechIOT Solutions
SA Population
SA Population Stats last updated on 2020-10-20
© Copyright.
Data source: SA Department of Health www.health.gov.za/
Male  Male % of  Ntnl Female  Female %  of Ntnl Total  Total % of  Ntnl Eastern Cape  3 176 433 10.9% 3 557 568 11.7% 6 734 001 11.3% Free State  1 414 517 4.9% 1 514 385 5.0% 2 928 902 4.9% Gauteng  7 754 633 26.6% 7 733 501 25.4% 15 488 134 26.0% KwaZulu-Natal  5 516 179 18.9% 6 015 453 19.7% 11 531 632 19.3% Limpopo  2 774 131 9.5% 3 078 423 10.1% 5 852 554 9.8% Mpumalanga  2 307 205 7.9% 2 372 578 7.8% 4 679 783 7.8% Northern Cape  640 506 2.2% 652 279 2.1% 1 292 785 2.2% North West  2 090 674 7.2% 2 018 142 6.6% 4 108 816 6.9% Western Cape  3 454 598 11.9% 3 551 142 11.6% 7 005 740 11.8% TOTAL 29 128 876 100.0% 30 493 471 100.0% 59 622 347 100.0%
www.navchun.com www.navchun.com www.navchun.com 3.2  1.4  7.8  5.5  2.8  2.3  0.6  2.1  3.5  3.6  1.5  7.7  6.0  3.1  2.4  0.7  2.0  3.6  6.7  2.9  15.5  11.5  5.9  4.7  1.3  4.1  7.0  0 2 4 6 8 10 12 14 16 18 Eastern Cape Free State Gauteng KwaZulu-Natal Limpopo Mpumalanga Northern Cape North West Western Cape Millions Population Distribution Male               Female www.navchun.com
TOP